PCA for Clustering
Principal Component Analysis (PCA) is a fundamental tool in unsupervised learning that is frequently used in clustering. By reducing the dimensionality of high-dimensional datasets, PCA helps make clustering algorithms more efficient and effective. This article delves into the theoretical foundations of PCA, its application in clustering, and the mathematical underpinnings that make it a powerful tool.
For a detailed discussion of PCA from a linear algebra perspective, refer to Principal Component Analysis (PCA) using Linear Algebra.
1. What is Principal Component Analysis (PCA)?
Principal Component Analysis (PCA) is a technique used for reducing the dimensionality of large datasets, increasing interpretability, while minimizing information loss. It does so by creating new uncorrelated variables (principal components) that are linear combinations of the original features.
1.1 Mathematical Definition
PCA transforms a dataset , where is the number of data points and is the number of features, into a new set of variables , where is the reduced number of dimensions. The principal components (PCs) are orthogonal vectors that maximize the variance in the data.
Given the covariance matrix of the data, the principal components are found by solving the eigenvalue problem:
where are the eigenvalues and are the eigenvectors of the covariance matrix. The eigenvectors are the directions (principal components), and the eigenvalues measure the variance in these directions.
The new dataset is given by:
where consists of the top eigenvectors corresponding to the largest eigenvalues.
1.2 Geometric Interpretation
Geometrically, PCA projects the data onto a new set of orthogonal axes (principal components) such that the first principal component captures the maximum variance, the second captures the next highest variance orthogonal to the first, and so on. This process creates a reduced-dimensional space where the most significant variance is retained.
2. Role of PCA in Clustering
2.1 Dimensionality Reduction
One of the primary reasons PCA is used in clustering is its ability to reduce dimensionality. Clustering algorithms often struggle in high-dimensional spaces because the distance between points becomes less meaningful, a phenomenon known as the curse of dimensionality.
By reducing the number of dimensions, PCA simplifies the data while preserving its structure, making clustering algorithms like K-Means or DBSCAN more effective.
2.2 Noise Reduction
PCA helps in reducing noise by discarding components with smaller eigenvalues, which often correspond to noise in the data rather than meaningful variation. This enhances the robustness of clustering algorithms, leading to better cluster separability.
2.3 Visualizing Clusters with PCA
In many clustering tasks, visualizing high-dimensional data is challenging. PCA allows us to reduce the data to two or three dimensions for visualization while retaining most of the relevant information.
Example: Visualizing Clusters in 2D Using PCA
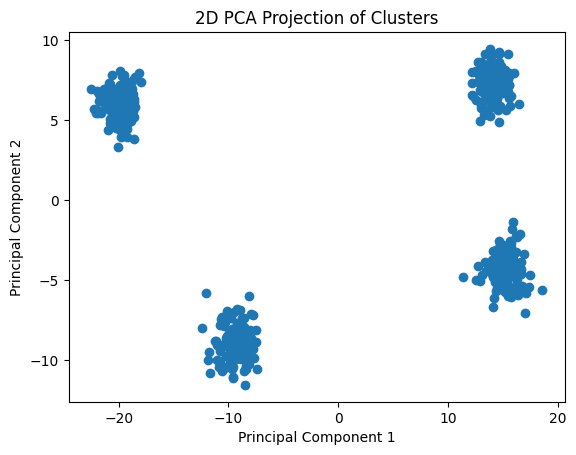
Let’s take a synthetic dataset, apply PCA, and visualize it in two dimensions:

Figure 1: PCA Cluster Visualization - This image illustrates how Principal Component Analysis (PCA) transforms high-dimensional data into a lower-dimensional space, enabling clearer separation of clusters.
2.4 Mathematical Details of the Transformation
Given the dataset , the steps involved in applying PCA for clustering are as follows:
-
Standardize the Data: Compute the mean and subtract it from each feature to center the data:
-
Compute the Covariance Matrix: The covariance matrix is computed as:
-
Eigenvalue Decomposition: Solve for the eigenvalues and eigenvectors of the covariance matrix :
-
Select Principal Components: Order the eigenvectors by their corresponding eigenvalues, and select the top eigenvectors.
-
Project the Data: The data is projected onto the new space defined by the top principal components:
3. Practical Considerations and Challenges
3.1 Choosing the Number of Components
Selecting the right number of principal components is crucial. The goal is to retain enough components to capture most of the variance while discarding noise. This can be guided by examining the explained variance ratio:
Typically, we aim to select enough components to capture 90–95% of the variance.
3.2 PCA and Non-Linear Relationships
While PCA is effective for linear relationships, it may not capture non-linear patterns in the data. For datasets with non-linear structures, techniques such as Kernel PCA or t-SNE might be more appropriate. These methods can reveal non-linear clusters that are not captured by standard PCA.
3.3 The Curse of Dimensionality
In very high-dimensional datasets, even after PCA is applied, clustering algorithms may still face difficulties due to sparse data. Careful consideration must be given to how much dimensionality reduction is applied and the nature of the data.
4. Conclusion
Principal Component Analysis (PCA) is an indispensable tool for clustering in high-dimensional datasets. By reducing the number of dimensions while preserving the variance, PCA enhances the performance of clustering algorithms, simplifies visualizations, and reduces noise. Understanding the mathematical foundation and practical considerations of PCA enables data scientists to use it effectively in unsupervised learning tasks.
For more detailed insights on PCA’s mathematical foundations, please refer to Principal Component Analysis (PCA) using Linear Algebra.