Annotations and Text in Matplotlib
Annotations and text are powerful tools in Matplotlib that allow you to highlight specific data points, add notes, or provide additional context to your visualizations. In this article, we’ll explore how to add text annotations, arrows, and custom text to your plots.
1. Adding Basic Text Annotations
Text annotations are useful for calling out specific data points or areas in your plot. You can add text using the plt.text() function.
1.1 Adding Text Annotations to a Plot
The plt.text() function places text at a specific location on the plot, using x and y coordinates.
import matplotlib.pyplot as plt

# Sample data
x = [1, 2, 3, 4, 5]
y = [10, 20, 25, 30, 35]

# Creating a basic plot
plt.plot(x, y)

# Adding a text annotation
plt.text(3, 25, 'Peak Value', fontsize=12, color='red')
plt.title('Plot with Text Annotation')
plt.xlabel('X-axis')
plt.ylabel('Y-axis')
plt.show()
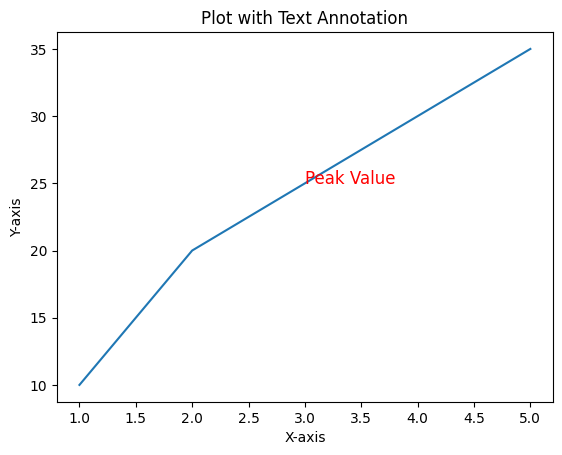
Figure 1: Plot with Text Annotation Example.
1.2 Positioning Text with Alignment
You can adjust the alignment of the text relative to its position using ha (horizontal alignment) and va (vertical alignment) parameters.
# Adding a text annotation with alignment
plt.plot(x, y)
plt.text(3, 25, 'Peak Value', fontsize=12, color='red', ha='center', va='bottom')
plt.title('Aligned Text Annotation')
plt.xlabel('X-axis')
plt.ylabel('Y-axis')
plt.show()
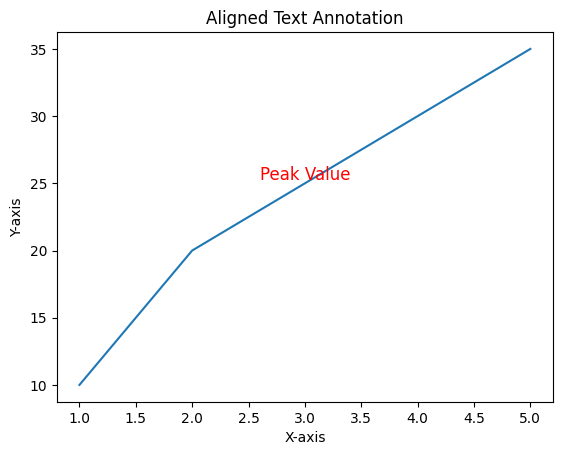
Figure 2: Plot with Positioned Text Annotation Example.
2. Annotating with Arrows
Arrows can make annotations more precise by pointing directly to a specific data point. The plt.annotate() function is used to add text with arrows.
2.1 Adding an Arrow Annotation
The plt.annotate() function allows you to annotate a point with text and an arrow.
# Adding an arrow annotation
plt.plot(x, y)
plt.annotate('Peak Value', xy=(3, 25), xytext=(4, 20),
             arrowprops=dict(facecolor='black', arrowstyle='->'))
plt.title('Plot with Arrow Annotation')
plt.xlabel('X-axis')
plt.ylabel('Y-axis')
plt.show()
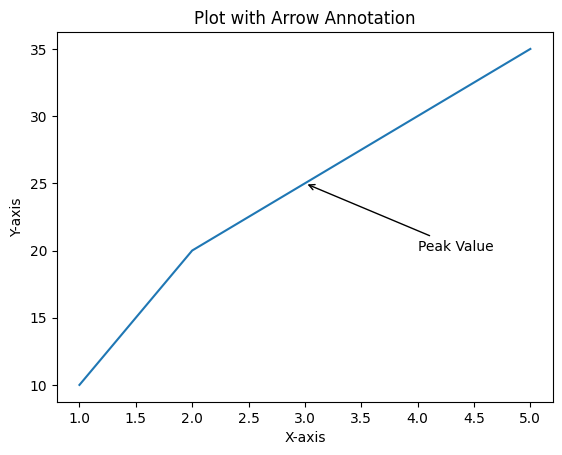
Figure 3: Plot with Arrow and Text Annotation Example.
2.2 Customizing Arrow Properties
You can customize the appearance of the arrow using the arrowprops dictionary.
# Customizing the arrow
plt.plot(x, y)
plt.annotate('Peak Value', xy=(3, 25), xytext=(4, 20),
             arrowprops=dict(facecolor='blue', arrowstyle='-|>', linewidth=2))
plt.title('Customized Arrow Annotation')
plt.xlabel('X-axis')
plt.ylabel('Y-axis')
plt.show()
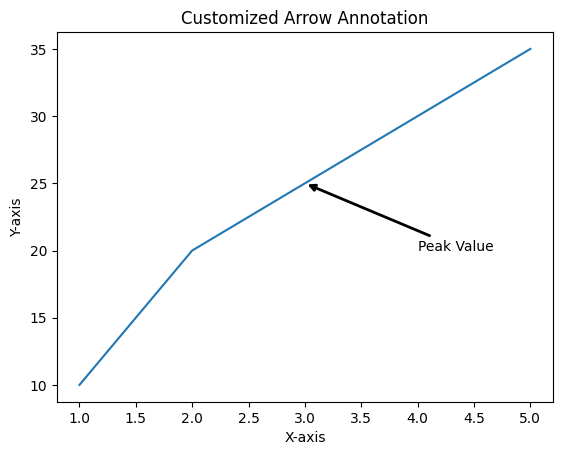
Figure 4: Plot with Custom Arrow and Text Annotation Example.
3. Adding Multiple Annotations
You can add multiple annotations to highlight different points or aspects of your data.
3.1 Example with Multiple Annotations
# Sample data
y2 = [15, 18, 22, 28, 32]

# Creating a plot with multiple annotations
plt.plot(x, y, label='Series 1')
plt.plot(x, y2, label='Series 2')

# Adding annotations
plt.annotate('Series 1 Peak', xy=(3, 25), xytext=(4, 22),
             arrowprops=dict(facecolor='black', arrowstyle='->'))
plt.annotate('Series 2 Peak', xy=(5, 32), xytext=(4, 30),
             arrowprops=dict(facecolor='black', arrowstyle='->'))

plt.title('Plot with Multiple Annotations')
plt.xlabel('X-axis')
plt.ylabel('Y-axis')
plt.legend()
plt.show()
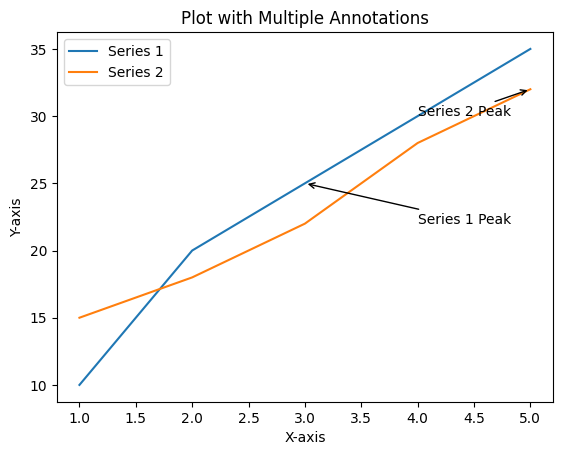
Figure 5: Plot with Multiple Annotations Example.
4. Customizing Fonts and Text Appearance
Matplotlib allows you to customize the font properties of your text annotations, including the font size, weight, and family.
4.1 Customizing Font Size and Weight
You can adjust the size and weight of the text to make annotations stand out.
# Customizing font size and weight
plt.plot(x, y)
plt.annotate('Peak Value', xy=(3, 25), xytext=(4, 20),
             fontsize=14, fontweight='bold', arrowprops=dict(facecolor='black'))
plt.title('Customized Font Size and Weight')
plt.xlabel('X-axis')
plt.ylabel('Y-axis')
plt.show()
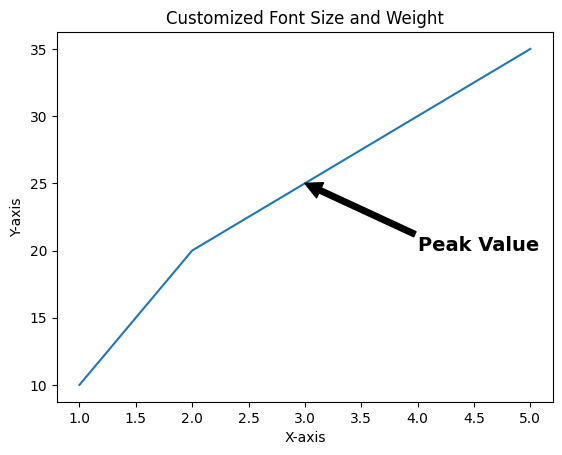
Figure 6: Plot Annotation with Custom Font Size and Weight Example.
4.2 Using Different Font Families
You can change the font family to match the style of your plot or presentation.
# Customizing font family
plt.plot(x, y)
plt.annotate('Peak Value', xy=(3, 25), xytext=(4, 20),
             fontsize=12, fontfamily='serif', arrowprops=dict(facecolor='black'))
plt.title('Customized Font Family')
plt.xlabel('X-axis')
plt.ylabel('Y-axis')
plt.show()
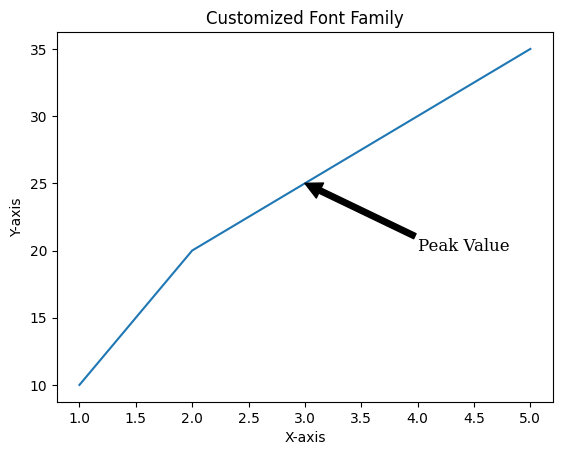
Figure 7: Plot Annotation Different Font Families Example.
5. Adding Text Outside the Plot Area
Sometimes, you may want to add text outside the main plot area, such as notes or additional information.
5.1 Adding Text in the Margins
You can use the plt.figtext() function to add text outside the plot area.
# Adding text in the margin
plt.plot(x, y)
plt.title('Plot with Margin Text')
plt.xlabel('X-axis')
plt.ylabel('Y-axis')

# Adding text in the margin
plt.figtext(0.1, 0.02, 'Note: This is a sample plot.', fontsize=10, color='gray')

plt.show()
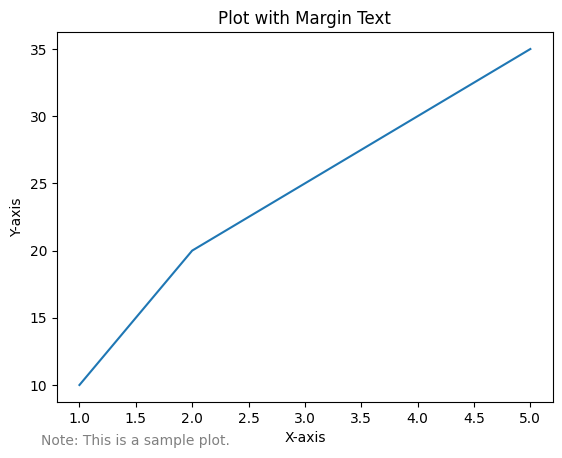
Figure 8: Plot with Text outside the Plot Example.
6. Conclusion
Annotations and text are essential tools in Matplotlib for adding context and emphasis to your visualizations. By mastering these techniques, you can create more informative and engaging plots that effectively communicate your data's story. In the next article, we'll explore advanced plot types in Matplotlib, including heatmaps, 3D plots, and contour plots.