Matplotlib for Interactive Visualizations
Matplotlib is not just for static plots—it also offers interactive features that can enhance your data exploration and presentation. In this article, we'll explore how to enable interactivity in your plots, including zooming, panning, and using interactive widgets in Jupyter Notebooks.
1. Using Interactive Backends in Matplotlib
To enable interactivity in Matplotlib, you need to use an interactive backend. This allows for real-time updates and interaction with your plots.
1.1 Choosing an Interactive Backend
You can switch to an interactive backend using the %matplotlib magic command in Jupyter Notebooks.
# Enabling the interactive backend
%matplotlib inline
import matplotlib.pyplot as plt
1.2 Interactive Features: Zooming and Panning
Once an interactive backend is enabled, you can zoom in and out and pan across the plot by clicking and dragging the mouse.
2. Adding Interactivity with Widgets in Jupyter Notebooks
Jupyter Notebooks provide an excellent environment for interactive data analysis. You can add widgets to your plots to create dynamic and interactive visualizations.
2.1 Introduction to ipywidgets
The ipywidgets library allows you to add interactive widgets like sliders, buttons, and dropdowns to your plots.
# Install ipywidgets if you haven't already
pip install ipywidgets
2.2 Creating an Interactive Plot with a Slider
You can use sliders to control parameters in your plot dynamically.
%matplotlib inline
import matplotlib.pyplot as plt
import numpy as np
import ipywidgets as widgets
from ipywidgets import interact

# Sample function to plot
def plot_sine_wave(frequency):
    x = np.linspace(0, 2 * np.pi, 1000)
    y = np.sin(frequency * x)

    plt.figure()
    plt.plot(x, y)
    plt.title(f'Sine Wave with Frequency {frequency} Hz')
    plt.show()

# Creating an interactive slider
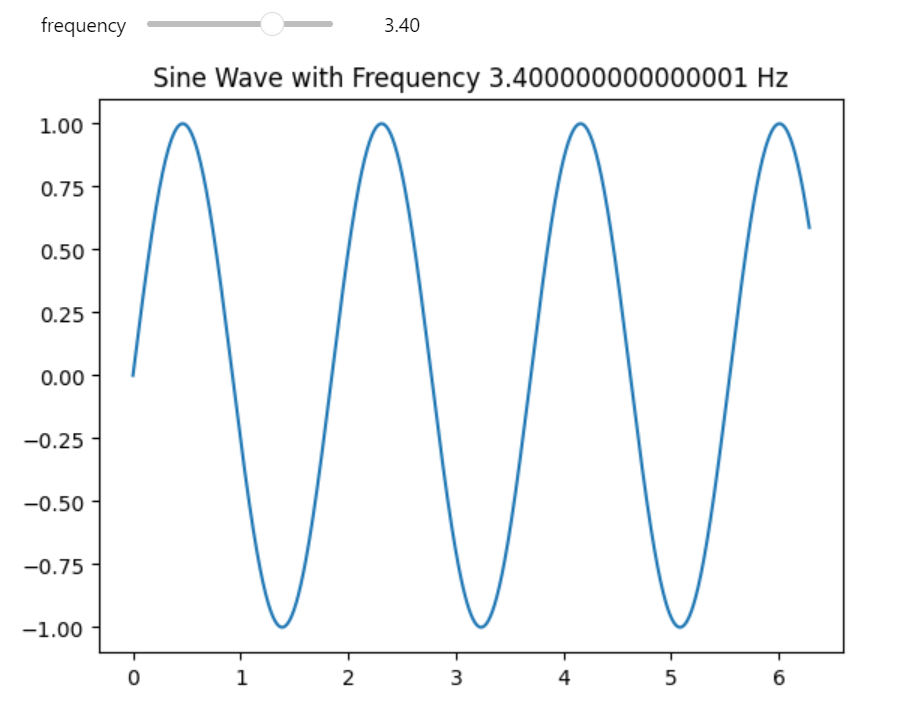
interact(plot_sine_wave, frequency=widgets.FloatSlider(min=0.1, max=5.0, step=0.1, value=1.0))

Figure 1: Interactive Plot Example.
2.3 Adding Multiple Widgets
You can combine multiple widgets to control different aspects of your plot.
%matplotlib inline
# Sample function with two parameters
def plot_wave(frequency, amplitude):
    x = np.linspace(0, 2 * np.pi, 1000)
    y = amplitude * np.sin(frequency * x)

    plt.figure()
    plt.plot(x, y)
    plt.title(f'Sine Wave with Frequency {frequency} Hz and Amplitude {amplitude}')
    plt.show()

# Creating interactive widgets
interact(plot_wave,
         frequency=widgets.FloatSlider(min=0.1, max=5.0, step=0.1, value=1.0),
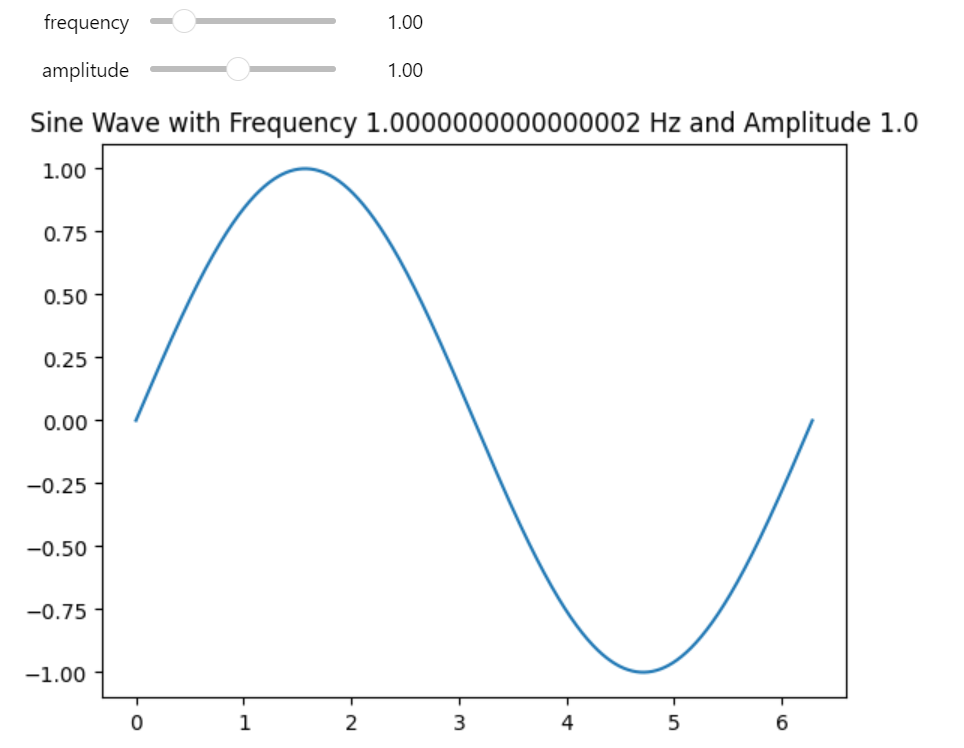
         amplitude=widgets.FloatSlider(min=0.1, max=2.0, step=0.1, value=1.0))

Figure 2: Interactive Plot with Multiple Widgets Example.
2.4 Interactive Plotting in Real-Time
You can create plots that update in real-time as you adjust the widgets.
%matplotlib inline
import matplotlib.pyplot as plt
import numpy as np
import ipywidgets as widgets
from ipywidgets import interact

# Function to update plot in real-time
def plot_real_time(frequency):
    x = np.linspace(0, 2 * np.pi, 1000)
    y = np.sin(frequency * x)

    plt.cla()  # Clear the current plot
    plt.plot(x, y)
    plt.title(f'Real-Time Sine Wave with Frequency {frequency} Hz')
    plt.draw()  # Redraw the plot

# Create a figure
plt.figure()

# Adding the interactive widget
interact(plot_real_time, frequency=widgets.FloatSlider(min=0.1, max=5.0, step=0.1, value=1.0))
3. Advanced Interactivity: Linking Plots and Data
For more advanced interactivity, you can link multiple plots together or interact with data directly from your plots.
3.1 Linking Plots Together
You can link multiple plots so that interactions with one plot update another plot.
import matplotlib.pyplot as plt
import numpy as np
import ipywidgets as widgets
from ipywidgets import interact

# Sample data
x = np.linspace(0, 2 * np.pi, 1000)

# Function to update linked plots
def update_plots(frequency):
    y1 = np.sin(frequency * x)
    y2 = np.cos(frequency * x)

    fig, (ax1, ax2) = plt.subplots(1, 2, figsize=(10, 4))

    ax1.plot(x, y1)
    ax1.set_title('Sine Wave')

    ax2.plot(x, y2)
    ax2.set_title('Cosine Wave')

    plt.show()

# Creating the interactive widget
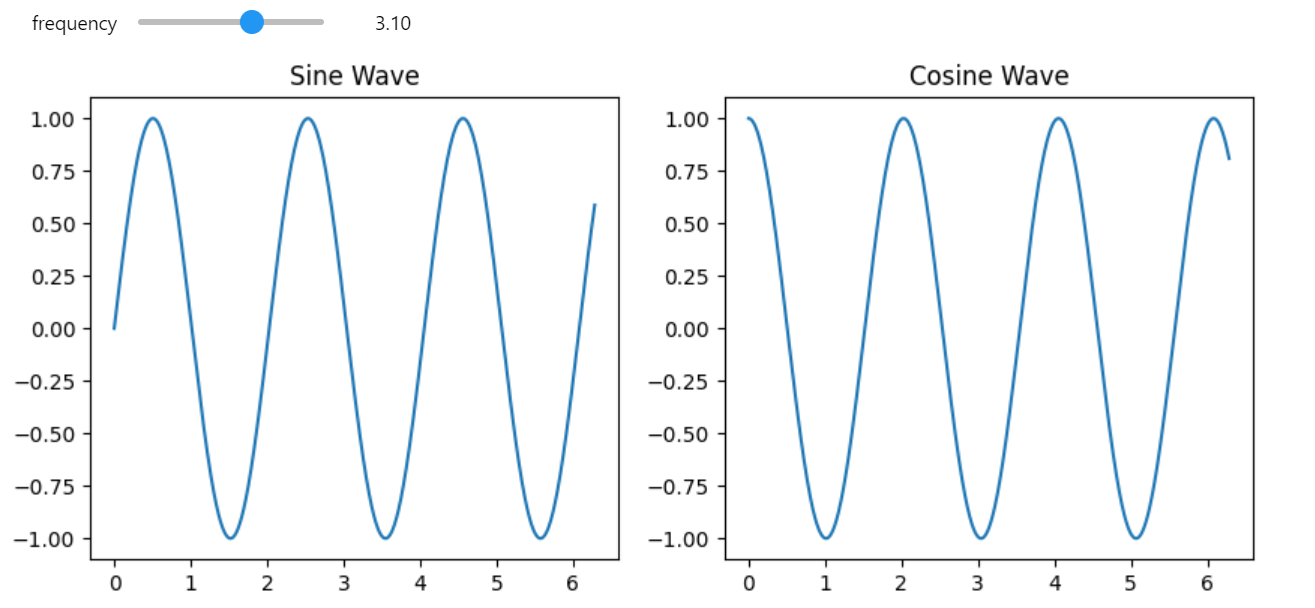
interact(update_plots, frequency=widgets.FloatSlider(min=0.1, max=5.0, step=0.1, value=1.0))

Figure 3: Multiple Interactive Plot Widgets Example.
4. Conclusion
Interactive visualizations in Matplotlib provide a dynamic way to explore and present your data. Whether you're adding interactivity for real-time data analysis or creating rich visual experiences in Jupyter Notebooks, these tools can greatly enhance your data science workflow. In the next article, we'll explore how to integrate Matplotlib with pandas for seamless data visualization.