Introduction to Matplotlib
Matplotlib is one of the most popular and widely used plotting libraries in Python. It provides a flexible and powerful framework for creating a wide range of static, animated, and interactive visualizations. Whether you're a beginner or an experienced data scientist, Matplotlib offers the tools you need to create insightful and effective data visualizations.
1. What is Matplotlib?
Matplotlib is a comprehensive library designed for creating static, animated, and interactive visualizations in Python. It was initially developed by John D. Hunter in 2003 as a way to generate plots similar to those in MATLAB. Over the years, it has become a standard tool in the Python data science ecosystem, often used in combination with libraries like pandas, NumPy, and SciPy.
1.1 Key Features of Matplotlib
- Versatility: Matplotlib can create a wide variety of plots and charts, including line plots, scatter plots, bar charts, histograms, pie charts, and more.
- Customization: Nearly every aspect of a plot can be customized, including colors, line styles, fonts, and more.
- Integration: Matplotlib integrates seamlessly with pandas, allowing you to plot data directly from DataFrames and Series.
- Interactivity: Matplotlib supports interactive plotting, making it useful for exploring data in real-time.
- Exporting: Plots can be saved in many formats, such as PNG, PDF, SVG, and EPS, making it easy to share your visualizations.
1.2 Why Use Matplotlib?
Matplotlib is favored for its flexibility and extensive customization options. It's suitable for creating everything from simple line plots to complex, multi-figure visualizations. Because of its versatility, Matplotlib is often the first choice for visualizing data in Python, especially when detailed control over plot appearance is required.
2. Getting Started with Matplotlib
Before you can start creating plots with Matplotlib, you need to ensure it is installed in your Python environment.
2.1 Installation
You can install Matplotlib using pip:
pip install matplotlib
Or, if you're using Anaconda:
conda install matplotlib
2.2 Importing Matplotlib
Once installed, you can start using Matplotlib by importing it into your Python script or Jupyter notebook.
import matplotlib.pyplot as plt
The pyplot module is the most commonly used part of Matplotlib, providing a simple interface for creating plots.
2.3 Your First Plot
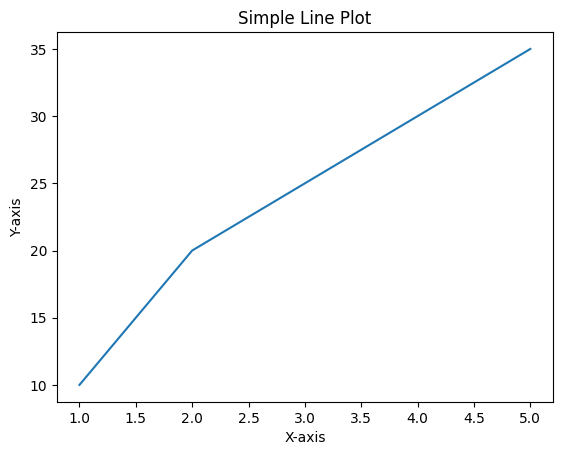
Let’s create a simple line plot to get familiar with Matplotlib's basic functionality.
import matplotlib.pyplot as plt

# Sample data
x = [1, 2, 3, 4, 5]
y = [10, 20, 25, 30, 35]

# Creating a line plot
plt.plot(x, y)
plt.title('Simple Line Plot')
plt.xlabel('X-axis')
plt.ylabel('Y-axis')
plt.show()
This code will produce a basic line plot with the given data points.

Figure 1: Simple Line Plot created with matplotlib.
3. Anatomy of a Matplotlib Plot
Understanding the components of a Matplotlib plot will help you create more complex visualizations.
3.1 Figure and Axes
- Figure: The overall window or page that everything is drawn on. You can think of the figure as the canvas.
- Axes: The area where data is plotted. A figure can contain multiple axes, which are like subplots.
# Creating a figure and axes
fig, ax = plt.subplots()
ax.plot(x, y)
plt.show()
3.2 Plot Elements
- Title: The title of the plot.
- Labels: Labels for the x-axis and y-axis.
- Ticks: Markings along the x-axis and y-axis that show the scale of the plot.
- Legend: An area that describes the elements of the plot, useful when plotting multiple datasets.
3.3 Customizing Your Plot
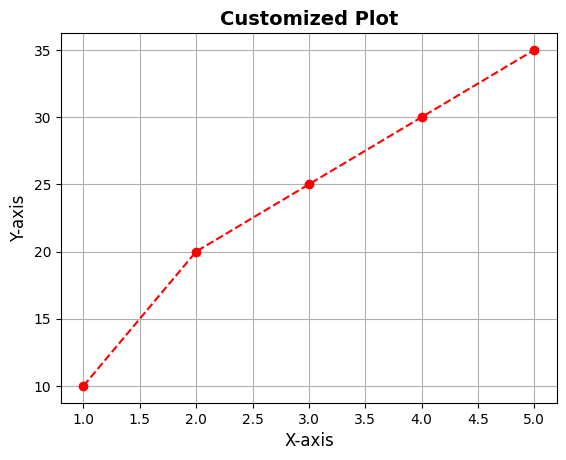
You can customize nearly every aspect of a Matplotlib plot, from colors and line styles to fonts and grid lines.
# Customizing a plot
plt.plot(x, y, color='red', linestyle='--', marker='o')
plt.title('Customized Plot', fontsize=14, fontweight='bold')
plt.xlabel('X-axis', fontsize=12)
plt.ylabel('Y-axis', fontsize=12)
plt.grid(True)
plt.show()

Figure 2: Customized Line Plot.
4. Saving and Sharing Your Plots
Once you have created a plot, you may want to save it as an image file. Matplotlib makes it easy to export plots in various formats.
4.1 Saving Plots
You can save a plot using the savefig() function.
# Saving a plot as a PNG file
plt.plot(x, y)
plt.savefig('line_plot.png')
4.2 Choosing File Formats
Matplotlib supports a range of file formats, including PNG, PDF, SVG, and EPS. Simply change the file extension in the savefig() function to save your plot in a different format.
5. Conclusion
Matplotlib is a powerful and flexible library for creating data visualizations in Python. Whether you need to create simple plots or complex visualizations, Matplotlib offers the tools you need to turn your data into insightful graphics. With a basic understanding of its features and how to get started, you are now ready to dive deeper into Matplotlib and explore its vast capabilities.
In the next article, we’ll look at how to create basic plots using Matplotlib, including line plots, bar charts, and histograms.