Working with Figures and Subplots in Matplotlib
In data analysis, it's often necessary to display multiple plots in a single figure for comparison or to present different aspects of the data. Matplotlib provides powerful tools for working with figures and subplots to achieve this. In this article, we'll explore how to create and arrange multiple plots using figures and subplots in Matplotlib.
1. Understanding Figures and Axes
In Matplotlib, a figure is the overall window or page that holds one or more axes (individual plots). Each axis can have its own title, labels, and content.
1.1 Creating a Figure
You can create a figure using the plt.figure() function.
import matplotlib.pyplot as plt

# Creating a figure
fig = plt.figure()
plt.plot([1, 2, 3], [4, 5, 6])
plt.title('Single Plot in a Figure')
plt.show()
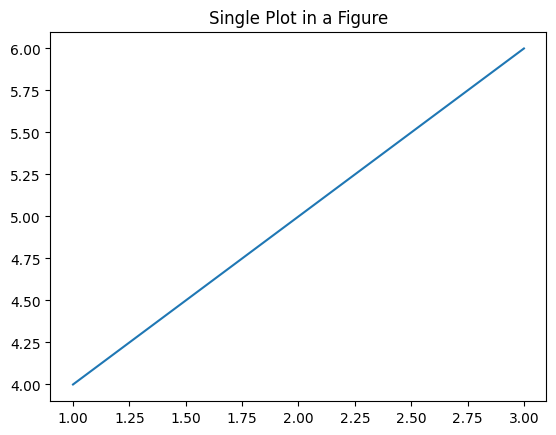
Figure 1: Single Plot.
1.2 Adding Axes to a Figure
Axes are added to a figure using the fig.add_subplot() method, which allows you to specify the number of rows, columns, and the position of the plot.
# Creating a figure with multiple axes
fig = plt.figure()

# Adding first subplot
ax1 = fig.add_subplot(2, 1, 1)
ax1.plot([1, 2, 3], [4, 5, 6])
ax1.set_title('First Subplot')

# Adding second subplot
ax2 = fig.add_subplot(2, 1, 2)
ax2.plot([1, 2, 3], [6, 5, 4])
ax2.set_title('Second Subplot')

plt.show()
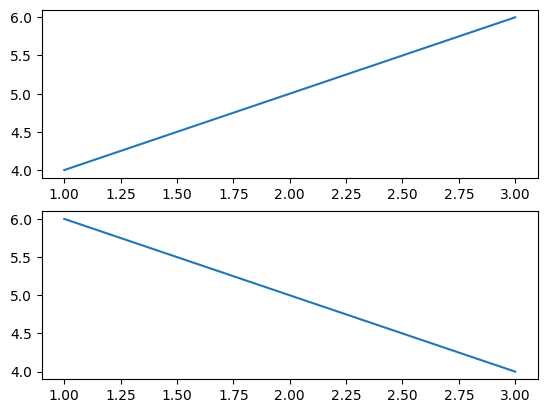
Figure 2: Add Sub-Plot Example outputs more than 1 plot at once.
2. Creating Subplots with plt.subplots()
The plt.subplots() function is a more convenient way to create figures with multiple subplots, allowing you to specify the layout in a single line.
2.1 Basic Subplots
You can create a grid of subplots using plt.subplots().
# Creating a 2x2 grid of subplots
fig, axs = plt.subplots(2, 2)

# First subplot
axs[0, 0].plot([1, 2, 3], [4, 5, 6])
axs[0, 0].set_title('Plot 1')

# Second subplot
axs[0, 1].plot([1, 2, 3], [6, 5, 4])
axs[0, 1].set_title('Plot 2')

# Third subplot
axs[1, 0].plot([1, 2, 3], [4, 6, 5])
axs[1, 0].set_title('Plot 3')

# Fourth subplot
axs[1, 1].plot([1, 2, 3], [5, 4, 6])
axs[1, 1].set_title('Plot 4')

plt.tight_layout()
plt.show()
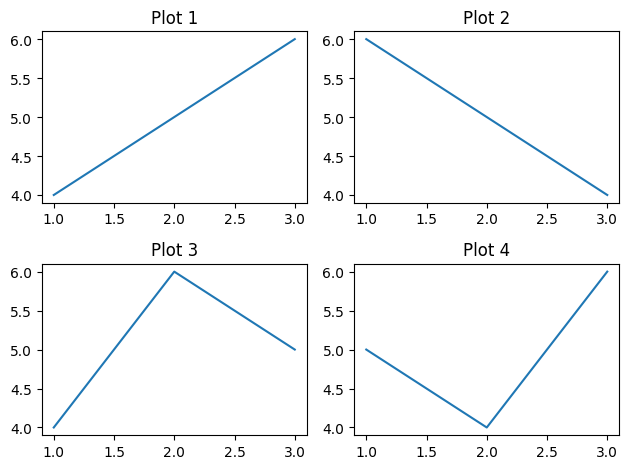
Figure 3: Add Sub-Plot with plt.subplots Example.
2.2 Sharing Axes
When creating subplots, you can share the x-axis or y-axis across plots for better comparison.
# Creating subplots with shared x-axis
fig, axs = plt.subplots(2, 1, sharex=True)

# First subplot
axs[0].plot([1, 2, 3], [4, 5, 6])
axs[0].set_title('Plot 1')

# Second subplot
axs[1].plot([1, 2, 3], [6, 5, 4])
axs[1].set_title('Plot 2')

plt.show()
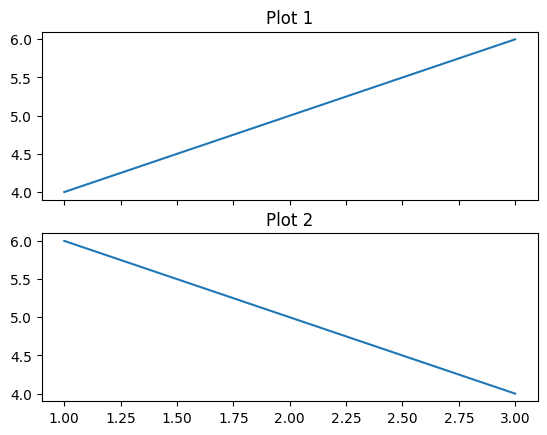
Figure 4: Sub-Plots sharing Axes.
2.3 Adjusting Spacing Between Subplots
You can adjust the spacing between subplots using plt.subplots_adjust() or the tight_layout() function.
# Adjusting spacing between subplots
fig, axs = plt.subplots(2, 2)
plt.subplots_adjust(wspace=0.5, hspace=0.5)  # Adjust spacing

# Creating plots
for i in range(2):
    for j in range(2):
        axs[i, j].plot([1, 2, 3], [4, 5, 6])

plt.show()
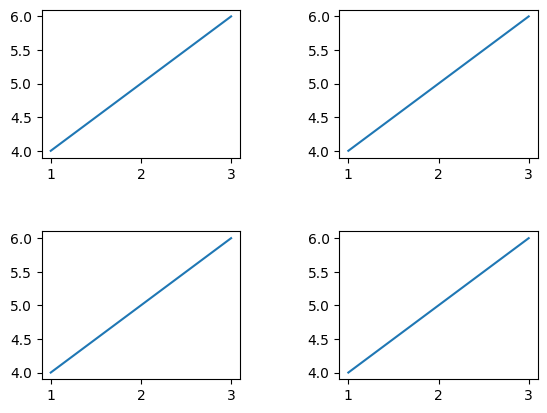
Figure 5: Ajusting Space between Sub-Plots.
3. Combining Plots with Different Sizes
You can combine plots of different sizes within a single figure by using a more flexible subplot layout or by adding axes manually.
3.1 Creating a Complex Layout with GridSpec
The GridSpec class allows you to create more complex subplot layouts.
from matplotlib.gridspec import GridSpec

# Creating a figure with GridSpec layout
fig = plt.figure()
gs = GridSpec(3, 3, figure=fig)

# Adding subplots with different sizes
ax1 = fig.add_subplot(gs[0, :])  # Full-width plot
ax2 = fig.add_subplot(gs[1, :-1])  # Two-thirds width
ax3 = fig.add_subplot(gs[1:, -1])  # Full-height on the right
ax4 = fig.add_subplot(gs[-1, 0])  # Bottom-left corner
ax5 = fig.add_subplot(gs[-1, -2])  # Bottom-middle

# Plotting data
ax1.plot([1, 2, 3], [4, 5, 6])
ax2.plot([1, 2, 3], [6, 5, 4])
ax3.plot([1, 2, 3], [5, 6, 4])
ax4.plot([1, 2, 3], [4, 6, 5])
ax5.plot([1, 2, 3], [6, 4, 5])

plt.tight_layout()
plt.show()
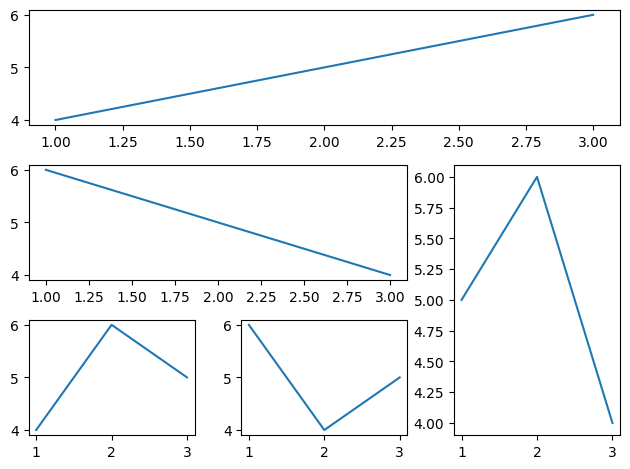
Figure 6: Complex Layout with GridSpec.
3.2 Manually Adding Axes
You can manually add axes to a figure at any position and size using fig.add_axes().
# Manually adding axes
fig = plt.figure()

# Main plot
ax1 = fig.add_axes([0.1, 0.1, 0.8, 0.8])
ax1.plot([1, 2, 3], [4, 5, 6])
ax1.set_title('Main Plot')

# Inset plot
ax2 = fig.add_axes([0.6, 0.6, 0.25, 0.25])
ax2.plot([1, 2, 3], [6, 5, 4])
ax2.set_title('Inset Plot')

plt.show()
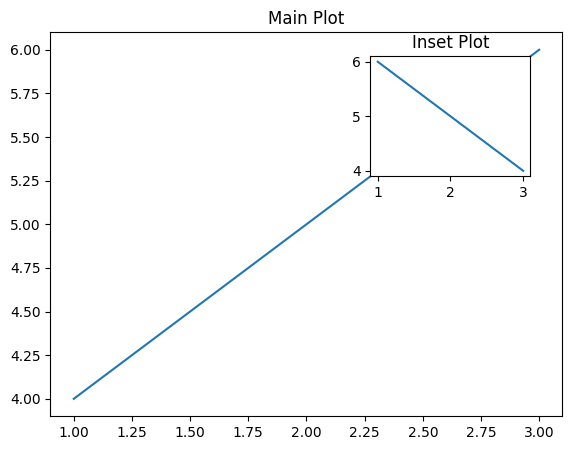
Figure 7: Manually Adding Axes to Figure.
4. Conclusion
Working with figures and subplots in Matplotlib allows you to create complex, multi-plot visualizations that are essential for comparative analysis and detailed presentations. By mastering these techniques, you can effectively convey multiple aspects of your data in a single figure. In the next article, we'll explore how to style and format your plots to make them more visually appealing.